Chapter 7 - Alternating Current - Introduction

This is Book 2
Chapter 7 - AC and Hertz
Chapter 8 - Magnetism
Chapter 8.2 - Inductors
Chapter 9 - Power Supply
Chapter 9.2 - Power Supply Filters
Chapter 10 - IC's and Amplifier
Chapter 10.2 - OP AMP Feedback and Unity Gain
Chapter 10.3 - OP AMP Non-Inverting
Chapter 10.4 - OP AMP Inverting
Chapter 11 - 555 Timer
Chapter 11.2 - Counters
Chapter 12 - Logic
Back To The Guide
Take Me Home
Wave Forms and Hertz
Up to now, the voltage supply's of the batteries provide a constant
unchanging voltage stream. This is called Direct Current or DC for
short. Next, consider a source of voltage that is not constant in
nature but, instead, is always changing over time or one that comes
in waves or bursts of energy. In these cases there are a few
additional characteristics to think about. The voltage level can
arrive in many different forms. The voltage level can be fluctuating
in amplitude, it can arrive in pulses or cycles, or in uniform or
random voltage patterns.
When the changing voltage levels, arrives in a uniform pattern, we
would want to consider the duration and time before another wave
arrives as well as comparing how one voltage level compares to the
one just prior to it. These issues open the topic of the duty cycle,
which include the repetitiveness of the voltage, the timing of the
voltage being present and the timing that the voltage is absent.
These voltage cycles are called Hertz. Hertz (Hz) representing the
cycles-per-second (cps), or frequently, of a voltage. The name is
given in honor of the German physicist Heinrich Hertz. Associated
with the term Hertz is the concept of Alternating Current or AC for short.
We use the concepts behind Hz and AC in everyday life without giving
them much thought. In the United States the frequency of the
electricity coming into homes is 60 Hz. This means the voltage changes
direction 120 times per second. In Europe the frequency is 50 Hz (100
direction changes per second). In some US military electronics the
frequency is 400 Hz. We buy toys, cordless phones, and computers that
are based on the KHz or MHz without really knowing or caring about the
internals of the equipment or toys.
Each country established its own frequency band allocations for
managing air bound transmitted, and energy radiation. In the USA the
US Federal Communication Commission is charged with sets rulings for
frequently bandwidth allocation.
Here are some commonly frequencies used in the USA.
Cordless phones - 43 kHz to 50 kHz
Toy walkie-talkies and toys-radio-controlled devices 49 kHz
AM Broadcast Band 530 KHz to 1700 KHz, allocated in 10 KHz blocks
FM Broadcast Band 88 MHz to 108 MHz, allocated in 200 KHz blocks
TV Channels 2 - 6 Band 54 MHz to 88 MHz
Air Traffic 118 MHz - 137 MHZ
Marine Radio Band 156 MHz to 158 MHz
NOAA Radio Band 162.40 MHz to 162.55 MHz
Pro. Wireless Microphones 174 MHz to 216 MHZ Band
TV Channels 7 - 13 Band 175 MHz to 216 MHz
Sine Wave Fundamentals:
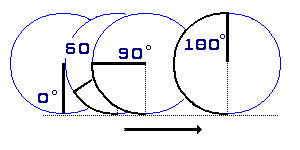
One way to describe the Hertz pattern is in an illustration. In this
illustration a sine wave is being mapped on a graph using a bicycle
wheel and mapping it to the road (graph). There are two different
concepts to consider here. The first is time and the second is amplitude.
First, consider the bicycle wheel following the roadway with the tire
touching the pavement but has not rotated yet. The valve stem is at
the bottom representing zero time and zero rotation.
As the bicycle moves forward the wheel rotates 60, 90, 180 and at some
time a full 360 degrees. Keeping the speed steady for this example with 15 degrees
of rotation every 5 seconds. Every 5 to 10 seconds place a mark on the
wheel where it is touching the road. ONE bicycle wheel rotation (1-cycle)
over ONE time. In this example the wheel is turning clockwise and moving
forward in time and in distance.
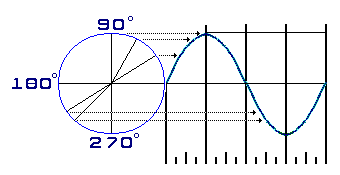
Ok, here is where it gets fun. In consideration number two, the same wheel is
now fixed, unable to rotate or move forward. Create a graph plotting the time on the x-axis.
The fixed wheel valve stem in pointing
forward on the x-axis of the graph. Using the same 45, 60, 90-degree
(and so on) marked on the wheel during "part one". Take your finger and
place it on the 45-degree point of the wheel. Plot that point on the
graph in both mplitude and in time. Notice where it is mapped to the
graph, then the 60 and the 90 and so on through the entire cycle. Your
finger is marking the coordinate positions by moving counter-clockwise
around the wheel. In effect while the wheel in "part one" was moving
clockwise, the point where the wheel contacts the roadway, is moving
counter clockwise at the same rate of speed.
In this wheel exercise, "part one" represents time(the period) mapped
to the x-axis. In "part two", the position of ones finger represents the
amplitude of the sine wave as it is mapped on the Y-axis, at any given
time. SO, at any given time there is one and only one amplitude. After
a full period the process starts again.
Sine Wave - Frequencies:
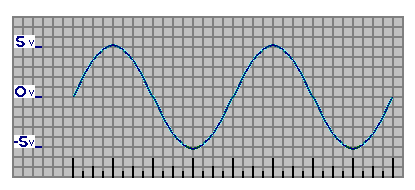
This illustration is called a graph or plot of the sine wave. It
displays 2 full sine wave cycles. It is a sine wave for 2 periods.
This is the same behavior as the AC power coming in your hours.
For this plot, the voltage starts at 0.0 Volts, at time 0 seconds.
It arcs up to where it peaks amplitude of + 5.0 V, at time 250
milliseconds. Next, the voltage arcs back down to 0.0 V, at time
500 ms. The wave continues its journey, this time going negative
until it peaks at -5.0 volts peak amplitude at time of 750 ms and
then returns back to 0.0 volts at the 1 second mark. This is one
cycle. The entire process then repeats for a additional cycle
t 0 seconds = 0 volts
t 250 ms = 5 volts
t 500 ms = 0 volts
t 750 ms = -5 volts
t 1.0 second = 0 volts
One electronic device that can capture this changing voltage and
display it graphically is called an oscilloscope.
This wave form can be described as a 10 volt peak-to-peak
sine wave form over a 1 second cycle, 1Hz. The peak-to-peak
voltage is measured from the plus peak voltage of +5V to
the minus peak voltage of -5V.
Each timing mark on the grid represents a 62.5 millisecond time interval.
The longest timing mark represents a 250 millisecond time interval.
One cycle per second is called a frequency of 1 Hz.
Final Note:
Sine wave voltage in non-linear. Take another look at the plot.
At t-0 there is 0 voltage, at t-0.250 there is a peak of 5 volts.
However the time half way between these two points at t-0.125 the
voltage is about 3.535 volts. This is 0.707 times the peak
voltage of 5 volts. This 0.707 value is called the RMS (root mean
square) value. In practical terms the RMS is the effective voltage
of the accumulated voltages over a period of time. The peak voltage
is important because it represents the maximum voltage in the circuit
at some point in time. All components need to be able to withstand
the peak voltage plus some additional room for protection.
Wave Forms and Hertz
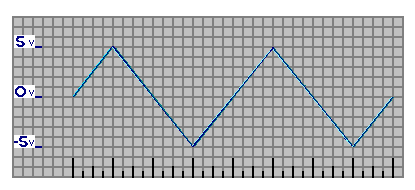
Next, take a look at the saw tooth wave pattern. It is similar to
the sign wave, with the notable difference that the voltage changes
linearly over time. This oscilloscope image displays two full time
cycles for the saw tooth wave form. This is also a 10-volt
peak-to-peak display with one cycle over 1 second or 1 Hz.
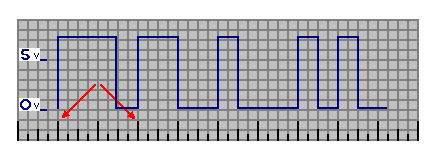
This oscilloscope display is a Square Wave pattern. There are 4
time cycles (periods) with each one being 1 second in length. Within
each 1 second in time, the voltage pattern is different.
In the 1st
period, as highlighted by the two red arrows, the voltage goes from
zero to +7.2V for 750 ms and to 0 V for 250 ms. This is a 750 ms pulse
width at the beginning of a 1 second cycle. Another way to state this is:
The voltage is 7.2 volts during the first 3/4 of the cycle then
zero volts the last 1/4 of the cycle.
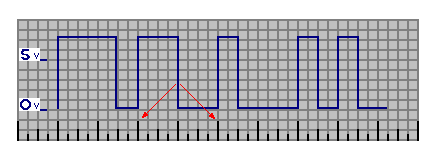
The this graph the 2nd period, as marked by red arrows, is also one
second in duration. The voltage peak is 7.2 V for half of a
cycle and zero volts for the other half of a second.
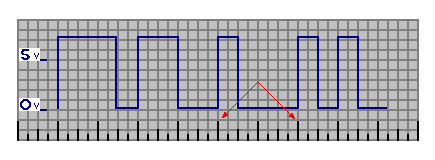
The 3rd time period, also marked with red arrows, is also one second in
duration. This voltage is on for only one forth of the period at 7.2V
then is 0 V for three-quarters of the time.
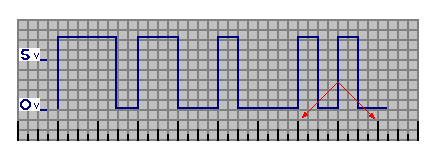
In the 4th time period of one second in duration, the 7.2 V pulse is on
for the first-quarter of the time, off for the second-quarter, on for
the third-quarter and off for the forth.
« Back to The Guide Next Chapter »
Email us: info@shoeboxkits.com